2014 UK local government election
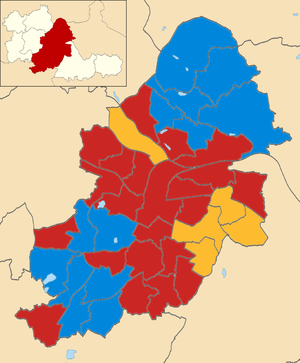
The 2014 Birmingham City Council election took place on 22 May 2014 to elect members of Birmingham City Council in England.[1] This was on the same day as other local elections.
All results[2] are compared to 2010 as that is the term which expired in 2014.
Result
Birmingham City Council Election Result 2014 | Party | Seats | Gains | Losses | Net gain/loss | Seats % | Votes % | Votes | +/− |
| | Labour | 77 |  2 2 |  0 0 | 2 | | | | |
| | Conservative | 31 | 2 | 0 | 2 | | | | |
| | Liberal Democrats | 12 | 0 |  3 3 | 3 | | | | |
| | UKIP | 0 | | | 0 | 0.0 | | | |
| | Green | 0 | | | 0 | 0.0 | | | |
| | Respect | 0 | | 1 | 1 | 0.0 | | | |
| | Socialist Labour | 0 | | | 0 | 0.0 | | | |
| | TUSC | 0 | | | 0 | 0.0 | | | |
| | SDP | 0 | | | 0 | 0.0 | | | |
| | Communities Against the Cuts | 0 | | | 0 | 0.0 | | | |
| | BNP | 0 | | | 0 | 0.0 | | | |
Results by ward
Acocks Green
Acocks Green 2014 | Party | Candidate | Votes | % | ±% |
| | Liberal Democrats | Roger Harmer | 2,679 | 45.7 | 3.8 |
| | Labour | Rachel Seabright | 2041 | 34.8 | 2.3 |
| | Green | Amanda Baker | 422 | 7.2 | 4.5 |
| | Conservative | Charlotte Hodivala | 372 | 6.3 | 7.3 |
| | TUSC | Eamonn Flynn | 254 | 4.3 | N/A |
| | SDP | Peter Johnson | 98 | 1.7 | 1.5 |
| Majority | 638 | 10.9 | 1.5 |
| Turnout | 5866 | | |
| | Liberal Democrats hold | Swing | | |
Aston
Aston 2014 | Party | Candidate | Votes | % | ±% |
| | Labour | Ziaul Islam | 4,175 | 68.7 | 13.9 |
| | Liberal Democrats | Sham Uddin | 1341 | 22.1 | 10.3 |
| | Conservative | Thomas Fraser Pike | 452 | 7.4 | 2.0 |
| | Independent | Abdusalam Smith | 108 | 1.8 | 1.3 |
| Majority | 2834 | 46.6 | 24.2 |
| Turnout | 6076 | | |
| | Labour hold | Swing | | |
Bartley Green
Bartley Green 2014 | Party | Candidate | Votes | % | ±% |
| | Conservative | Bruce Lines | 2,637 | 49.5 | 4.5 |
| | UKIP | Clair Felton | 1308 | 24.6 | N/A |
| | Labour | Mike Zamorski | 1108 | 20.8 | 12.1 |
| | Green | Minnie Rahman | 167 | 3.1 | 1.7 |
| | Liberal Democrats | Julia Garrett | 106 | 2.0 | 10.8 |
| Majority | 1329 | 25.0 | 12.9 |
| Turnout | 5326 | | |
| | Conservative hold | Swing | | |
Billesley
Billesley 2014 | Party | Candidate | Votes | % | ±% |
| | Labour | Alex Buchanan | 2,525 | 44.1 | 8.1 |
| | UKIP | James Dalton | 1499 | 26.2 | N/A |
| | Conservative | Andy Rudge | 1480 | 25.9 | 8.6 |
| | Liberal Democrats | Christopher Burgess | 218 | 3.8 | 11.3 |
| Majority | 1026 | 17.9 | 18.0 |
| Turnout | 5722 | | |
| | Labour hold | Swing | | |
Bordesley Green
Bordesley Green 2014 | Party | Candidate | Votes | % | ±% |
| | Labour | Mohammed Aikhlaq | 3,857 | 55.5 | 7.5 |
| | Liberal Democrats | Mohammed Saeed | 2310 | 33.2 | 5.0 |
| | UKIP | Arthur Davis | 386 | 5.6 | 3.0 |
| | Green | Alan Clawley | 193 | 2.8 | 0.5 |
| | Conservative | William Hordern | 171 | 2.5 | 5.3 |
| | TUSC | Theo Sharieff | 35 | 0.5 | N/A |
| Majority | 1547 | 22.3 | 12.4 |
| Turnout | 6952 | | |
| | Labour hold | Swing | | |
Bournville
Bournville 2014 | Party | Candidate | Votes | % | ±% |
| | Conservative | Rob Sealey | 3,220 | 41.4 | 5.0 |
| | Labour | Dee Smyth | 2466 | 31.7 | 0.6 |
| | UKIP | Ash Mondair | 883 | 11.4 | N/A |
| | Green | Cheryl Buxton-Sait | 703 | 9.0 | 3.3 |
| | Liberal Democrats | Steve Haynes | 295 | 3.8 | 17.9 |
| | Communities Against the Cuts | Robert Nickson | 203 | 2.6 | N/A |
| Majority | 754 | 9.7 | 4.3 |
| Turnout | 7770 | | |
| | Conservative hold | Swing | | |
Edgbaston
Edgbaston 2014 | Party | Candidate | Votes | % | ±% |
| | Conservative | Fergus Robinson | 2,235 | 44.0 | 2.2 |
| | Labour | Robbie Lea-Trengrouse | 2,061 | 40.6 | 0.7 |
| | UKIP | Keith Rowe | 470 | 9.3 | 6.6 |
| | Liberal Democrats | Kaneyalal Chudasama | 313 | 6.2 | 2.2 |
| Majority | 174 | 3.4 | 1.5 |
| Turnout | | | |
Erdington
Erdington 2014 | Party | Candidate | Votes | % | ±% |
| | Conservative | Robert Alden | 2,743 | | |
| | Labour Co-op | Keith Heron | 1,699 | | |
| | UKIP | Mel Ward | 703 | | |
| | Liberal Democrats | Philip Mills | 115 | | |
| | TUSC | Joe Foster | 79 | | |
| | BNP | Frances Waldron | 66 | | |
| Majority | 1,044 | | |
| Turnout | | | |
Hall Green
Hall Green 2014 | Party | Candidate | Votes | % | ±% |
| | Labour | Kerry Jenkins | 2,317 | | |
| | Liberal Democrats | Paula Smith | 1,822 | | |
| | Conservative | Steve Mee | 1,046 | | |
| | Independent | Bob Harvey | 972 | | |
| | UKIP | Vic East | 814 | | |
| Majority | 495 | | |
| Turnout | | | |
Handsworth Wood
Handsworth Wood 2014 | Party | Candidate | Votes | % | ±% |
| | Labour | Narinder Kooner | 4,009 | | |
| | Conservative | Sukhwinder Sungu | 862 | | |
| | Green | Eric Fairclough | 438 | | |
| | Socialist Labour | John Tyrrell | 392 | | |
| | Liberal Democrats | Paramjit Singh | 200 | | |
| Majority | 3,147 | | |
| Turnout | | | |
Harborne
Harborne 2014 | Party | Candidate | Votes | % | ±% |
| | Conservative | John Alden | 2,816 | 41.4 | |
| | Labour | Nabila Zulfiqar | 2,518 | 37.0 | |
| | Green | Phil Simpson | 637 | | |
| | UKIP | Charles Brecknell | 574 | | |
| | Liberal Democrats | Philip Banting | 258 | | |
| Majority | 298 | | |
| Turnout | | | |
| | Conservative hold | Swing | | |
Hodge Hill
Hodge Hill 2014 | Party | Candidate | Votes | % | ±% |
| | Labour | Fiona Williams | 2,848 | | |
| | UKIP | Adrian Duffen | 1,246 | | |
| | Liberal Democrats | Mohammad Azam | 1,057 | | |
| | Conservative | Cyrus Hodivala | 495 | | |
| Majority | 1,602 | | |
| Turnout | | | |
Kings Norton
Kings Norton 2014 | Party | Candidate | Votes | % | ±% |
| | Conservative | Simon Jevon | 1,837 | | |
| | Labour Co-op | Steve Bedser | 1,722 | | |
| | UKIP | Timothy Plumbe | 1,222 | | |
| | Liberal Democrats | Peter Lloyd | 213 | | |
| | Communities Against the Cuts | Christopher Hughes | 207 | | |
| Majority | 115 | | |
| Turnout | | | |
Kingstanding
Kingstanding 2014 | Party | Candidate | Votes | % | ±% |
| | Conservative | Ron Storer | 1,578 | | |
| | Labour | Desmond Hughes | 1,546 | | |
| | UKIP | Jan Higgins | 1,128 | | |
| | BNP | Frances Burke | 92 | | |
| | Liberal Democrats | Graham Lippiatt | 77 | | |
| Majority | 32 | | |
| Turnout | | | |
Ladywood
Ladywood 2014 | Party | Candidate | Votes | % | ±% |
| | Labour | Carl Rice | 2,308 | | |
| | Conservative | Tim Skidmore | 655 | | |
| | UKIP | John Hine | 396 | | |
| | Green | Hazel Clawley | 371 | | |
| | Liberal Democrats | Khondaker Alam | 221 | | |
| Majority | 1,653 | | |
| Turnout | | | |
Longbridge
Longbridge 2014 | Party | Candidate | Votes | % | ±% |
| | Labour Co-op | Ian Cruise | 1,669 | | |
| | Conservative | Derek Johnson | 1,598 | | |
| | UKIP | Steven Brookes | 1,544 | | |
| | Green | Aysha Turner | 238 | | |
| | Liberal Democrats | Kevin Hannon | 157 | | |
| | TUSC | Clive Walder | 55 | | |
| Majority | 71 | | |
| Turnout | | | |
N.B. Cruise left the Labour Party in August 2015 and now sits as an Independent.[3]
Lozells and East Handsworth
Lozells and East Handsworth 2014 | Party | Candidate | Votes | % | ±% |
| | Labour | Hendrina Quinnen | 4,179 | | |
| | Liberal Democrats | Talukder Hussain | 953 | | |
| | Conservative | Ravi Chumber | 478 | | |
| | TUSC | Alistair Wingate | 307 | | |
| Majority | 3,226 | | |
| Turnout | | | |
Moseley and Kings Heath
Moseley and Kings Heath 2014 | Party | Candidate | Votes | % | ±% |
| | Labour Co-op | Claire Spencer | 3,099 | | |
| | Liberal Democrats | Ernie Hendricks | 1,963 | | |
| | Green | Elly Stanton | 768 | | |
| | Conservative | Alistair Wingate | 623 | | |
| | UKIP | Alan Blumenthal | 494 | | |
| | TUSC | Michael Friel | 494 | | |
| Majority | 3,226 | | |
| Turnout | | | |
Nechells
Nechells 2014 | Party | Candidate | Votes | % | ±% |
| | Labour | Chauhdry Rashid | 3,156 | | |
| | Conservative | Abdi Elmi | 574 | | |
| | Green | Janet Assheton | 556 | | |
| | Liberal Democrats | Shazad Iqbal | 307 | | |
| Majority | 2,582 | | |
| Turnout | | | |
Northfield
Northfield 2014 | Party | Candidate | Votes | % | ±% |
| | Conservative | Randal Brew | 2,697 | | |
| | Labour Co-op | Carole Griffiths | 1,768 | | |
| | UKIP | Barrie Clews | 1,366 | | |
| | Green | Susan Pearce | 308 | | |
| | Liberal Democrats | Andrew Moles | 145 | | |
| | Communities Against the Cuts | Katherine Dunn | 86 | | |
| Majority | 929 | | |
| Turnout | | | |
Oscott
Oscott 2014 | Party | Candidate | Votes | % | ±% |
| | Labour | Barbara Dring | 1,962 | | |
| | UKIP | Roger Tempest | 1,623 | | |
| | Conservative | Graham Green | 1,364 | | |
| | Green | Harry Eyles | 188 | | |
| | Liberal Democrats | Nicholas Joliffe | 117 | | |
| Majority | 339 | | |
| Turnout | | | |
Perry Barr
Perry Barr 2014 | Party | Candidate | Votes | % | ±% |
| | Liberal Democrats | Karen Hamilton | 2,437 | | |
| | Labour Co-op | Sarfraiz Hussain | 2,278 | | |
| | UKIP | Charles Douglas | 908 | | |
| | Conservative | Georgina Chandler | 392 | | |
| Majority | 159 | | |
| Turnout | | | |
Quinton
Quinton 2014 | Party | Candidate | Votes | % | ±% |
| | Labour | Matthew Gregson | 2,612 | 42.3 | |
| | Conservative | Ian Colpman | 1,922 | 31.2 | |
| | UKIP | Laura Howard | 1,096 | | |
| | Green | Peter Beck | 329 | | |
| | Liberal Democrats | Ian Garrett | 175 | | |
| | TUSC | Nick Hart | 34 | | |
| Majority | 690 | | |
| Turnout | | | |
Selly Oak
Selly Oak 2014 | Party | Candidate | Votes | % | ±% |
| | Labour | Changese Khan | 1,684 | 32 | 12 |
| | Liberal Democrats | David Radcliffe | 1,609 | 31 | 1 |
| | Green | Joe Rooney | 711 | 14 | 7 |
| | Conservative | Monica Hardie | 687 | 13 | 1 |
| | UKIP | Peter Hughes | 498 | 10 | 6 |
| Majority | 75 | | |
| Turnout | 5189 | | |
| | Labour gain from Liberal Democrats | Swing | | |
Shard End
Shard End 2014 | Party | Candidate | Votes | % | ±% |
| | Labour | John Cotton | 1,791 | | |
| | UKIP | Iain Roden | 1,754 | | |
| | Conservative | Roger King | 446 | | |
| | Green | Stephen Parker | 301 | | |
| | BNP | Kevin McHugh | 134 | | |
| | Liberal Democrats | Christopher Barber | 132 | | |
| | TUSC | Ken Marks | 48 | | |
| Majority | 37 | | |
| Turnout | | | |
Sheldon
Sheldon 2014 | Party | Candidate | Votes | % | ±% |
| | Liberal Democrats | Mike Ward | 2,750 | 52.1 | |
| | UKIP | David Bridges | 1,262 | 23.9 | |
| | Labour | Bob Collins | 850 | 16.1 | |
| | Conservative | Keely Huxtable | 338 | 6.4 | |
| | TUSC | Mark Andrews | 80 | 1.5 | |
| Majority | 1,488 | | |
| Turnout | | | |
Soho
Soho 2014 | Party | Candidate | Votes | % | ±% |
| | Labour Co-op | Sharon Thompson | 4,026 | | |
| | Conservative | Robert Higginson | 557 | | |
| | Liberal Democrats | Cabdul Ruumi | 353 | | |
| | Green | Margaret Okole | 310 | | |
| Majority | 3,469 | | |
| Turnout | | | |
South Yardley
South Yardley 2014 | Party | Candidate | Votes | % | ±% |
| | Liberal Democrats | Zaker Choudhry | 2,614 | | |
| | Labour Co-op | Kate Booth | 2,448 | | |
| | UKIP | Albert Duffen | 1,060 | | |
| | Conservative | Julia Mackey | 279 | | |
| | Independent | Dave Willis | 86 | | |
| | TUSC | Siobhan Friel | 38 | | |
| Majority | 3,469 | | |
| Turnout | | | |
Sparkbrook
Sparkbrook 2014 | Party | Candidate | Votes | % | ±% |
| | Labour | Victoria Quinn | 5,382 | | |
| | Liberal Democrats | Asad Mehmood | 750 | | |
| | Conservative | John Turner | 341 | | |
| Majority | 4,632 | | |
| Turnout | | | |
Springfield
Springfield 2014 | Party | Candidate | Votes | % | ±% |
| | Labour | Mohammed Fazal | 3,845 | | |
| | Liberal Democrats | Tanveer Choudhry | 2,641 | | |
| | UKIP | Martin Barrett | 395 | | |
| | Conservative | David Agar | 384 | | |
| Majority | 1,204 | | |
| Turnout | | | |
Stechford and Yardley North
Stechford and Yardley North 2014 | Party | Candidate | Votes | % | ±% |
| | Liberal Democrats | Carol Jones | 2,685 | | |
| | Labour | Diane Donaldson | 1,523 | | |
| | UKIP | Graham Duffen | 1,128 | | |
| | Conservative | Robert Clark | 271 | | |
| | Green | Grant Bishop | 164 | | |
| Majority | 1,162 | | |
| Turnout | | | |
Stockland Green
Stockland Green 2014 | Party | Candidate | Votes | % | ±% |
| | Labour | Penny Holbrook | 3,451 | | |
| | Conservative | Daniel Caldicott | 494 | | |
| | TUSC | Ted Woodley | 347 | | |
| | Liberal Democrats | Franklyn Aaron | 294 | | |
| Majority | 2,957 | | |
| Turnout | | | |
Sutton Four Oaks
Sutton Four Oaks 2014 | Party | Candidate | Votes | % | ±% |
| | Conservative | Anne Underwood | 3,628 | | |
| | UKIP | Brendan Padmore | 1,370 | | |
| | Labour | Nick Preston | 884 | | |
| | Green | David Ratcliff | 343 | | |
| | Liberal Democrats | Hubert Duffy | 302 | | |
| Majority | 2,258 | | |
| Turnout | | | |
Sutton New Hall
Sutton New Hall 2014 | Party | Candidate | Votes | % | ±% |
| | Conservative | Ken Wood | 2,659 | | |
| | UKIP | Stewart Cotterill | 1,429 | | |
| | Labour | Ian Brindley | 1,129 | | |
| | Liberal Democrats | Trevor Holtom | 296 | | |
| Majority | 1,230 | | |
| Turnout | | | |
Sutton Trinity
Sutton Trinity 2014 (2) | Party | Candidate | Votes | % | ±% |
| | Conservative | Ewan Mackey | 2,985 | | |
| | Conservative | Margaret Waddington | 2,916 | | |
| | UKIP | Marcus Brown | 1,617 | | |
| | Labour | Roger Barley | 1,514 | | |
| | Labour | Philip Innamorati | 1,154 | | |
| | Liberal Democrats | Sally Lippiatt | 571 | | |
| Majority | | | |
| Turnout | | | |
Sutton Vesey
Sutton Vesey 2014 | Party | Candidate | Votes | % | ±% |
| | Conservative | Andrew Hardie | 2,564 | | |
| | Labour | Manish Puri | 2,314 | | |
| | UKIP | Albert Meehan | 1,229 | | |
| | Liberal Democrats | Lynn Williams | 332 | | |
| Majority | 250 | | |
| Turnout | | | |
Tyburn
Tyburn 2014 | Party | Candidate | Votes | % | ±% |
| | Labour | Lynda Clinton | 2,171 | | |
| | Conservative | Clifton Welch | 864 | | |
| | Liberal Democrats | Ann Holtom | 647 | | |
| | TUSC | James Redfern | 379 | | |
| Majority | 1,307 | | |
| Turnout | | | |
Washwood Heath
Washwood Heath 2014 | Party | Candidate | Votes | % | ±% |
| | Labour | Mohammed Idrees | 6,598 | | |
| | Liberal Democrats | Waheed Rafiq | 537 | | |
| | Conservative | Alexander Hall | 352 | | |
| | Green | John Bentley | 374 | | |
| Majority | 6,061 | | |
| Turnout | | | |
Weoley
Weoley 2014 | Party | Candidate | Votes | % | ±% |
| | Conservative | Peter Douglas | 2,287 | | |
| | Labour | Stephen Booton | 1,780 | | |
| | UKIP | Kevin Morris | 1,205 | | |
| | Green | Anna Masters | 305 | | |
| | Liberal Democrats | Sally Haynes-Preece | 223 | | |
| Majority | 507 | | |
| Turnout | | | |
References
- ^ "England council results". BBC News. Retrieved 23 May 2014.
- ^ "Election Results 2014". Birmingham City Council. Retrieved 5 April 2017.
- ^ Neil Elkes (31 August 2015). "Councillor quits Birmingham Labour - with blast at 'indiscipline' and 'pettiness'". The Birmingham Mail. Retrieved 18 March 2018.


 2
2  0
0  3
3  Council elections in the West Midlands


