1992 UK local government election
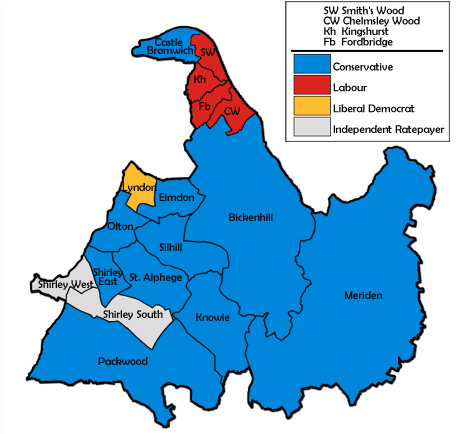
Map of the results for the 1992 Solihull council election. The 1992 Solihull Metropolitan Borough Council elections were held on Thursday, 7 May 1992, with one third of the council to be elected. The council remained under no overall control with the Conservatives three seats short of a majority. Voter turnout was 37.8%.[1] [2]
Election result Solihull Local Election Result 1992 Party Seats Gains Losses Net gain/loss Seats % Votes % Votes +/− Conservative 10 1 0 +1 58.8 57.0 33,601 +10.8 Labour 4 0 1 -1 23.5 16.8 9,935 -6.2 Independent Ratepayers & Residents 2 0 0 0 11.8 8.8 5,187 +0.5 Liberal Democrats 1 0 0 0 5.9 15.5 9,165 -3.0 Green 0 0 0 0 0.0 1.9 1,095 -1.7
This result had the following consequences for the total number of seats on the council after the elections:
Party Previous council New council Conservatives 23 24 Labour 16 15 Independent Ratepayers & Residents 6 6 Liberal Democrats 6 6 Total 51 51 Working majority -5 -3
Ward results Bickenhill[1] Party Candidate Votes % ±% Conservative Elizabeth Plaister 2,524 63.1 +8.3 Labour Jeffrey Potts 1,272 31.8 -4.6 Green Pamela Archer 204 5.1 -3.7 Majority 1,252 31.3 +12.9 Turnout 4,000 40.7 -11.6 Conservative hold Swing +6.4
Castle Bromwich[1] Party Candidate Votes % ±% Conservative George Richards 3,017 77.8 +13.7 Labour Robert Davis 742 19.1 -9.8 Green M. Dudley 119 3.1 -3.9 Majority 2,275 58.7 +23.5 Turnout 3,878 39.9 -7.1 Conservative hold Swing +11.7
Chelmsley Wood[1] Party Candidate Votes % ±% Labour Alfred Hill 971 53.3 -8.7 Conservative Beryl Kellie 703 38.6 +14.1 Liberal Democrats Olive Hogg 147 8.1 -5.4 Majority 268 14.7 -22.8 Turnout 1,821 20.7 -7.5 Labour hold Swing -11.4
Elmdon[1] Party Candidate Votes % ±% Conservative Donald Jones 1,831 49.2 +9.0 Labour Eileen Turner 1,410 37.9 -5.1 Independent Herbert Hitchcock 481 12.9 -3.9 Majority 421 11.3 +8.5 Turnout 3,722 44.5 -7.8 Conservative gain from Labour Swing +7.0
Fordbridge[1] Party Candidate Votes % ±% Labour Michael Corser 800 56.9 -3.7 Conservative Michael Wyldbore-Smith 494 35.1 +10.2 Liberal Democrats A. Blakeley 112 8.0 -2.0 Majority 306 21.8 -13.9 Turnout 1,406 20.3 -8.7 Labour hold Swing -6.9
Kingshurst[1] Party Candidate Votes % ±% Labour Frederick Allen 952 55.2 -9.3 Conservative Dorothy Wallace 705 40.9 +15.7 Green Trevor Barker 68 3.9 +0.3 Majority 247 14.3 -25.0 Turnout 1,725 27.3 -11.3 Labour hold Swing -12.5
Knowle[1] Party Candidate Votes % ±% Conservative Leslie Kyles 2,825 75.0 +10.5 Liberal Democrats Bernadette Pruden 750 19.9 -8.1 Labour Vera Wood 191 5.1 -2.3 Majority 2,075 55.1 +18.6 Turnout 3,766 43.0 -6.7 Conservative hold Swing +9.3
Lyndon [1] Party Candidate Votes % ±% Liberal Democrats Richard Balmer 1,775 52.0 -4.0 Conservative Gloria Cox 1,333 39.1 +10.6 Labour Joan Holt 305 8.9 -6.5 Majority 442 12.9 -14.6 Turnout 3,413 41.4 -8.0 Liberal Democrats hold Swing -7.3
Meriden [1] Party Candidate Votes % ±% Conservative Alan Vincent 2,263 69.1 +11.2 Liberal Democrats Richard Morris 742 22.7 -8.8 Labour Arthur Brill 269 8.2 -2.3 Majority 1,521 46.5 +20.0 Turnout 3,274 38.8 -11.5 Conservative hold Swing +10.0
Olton [1] Party Candidate Votes % ±% Conservative Diana Holl-Allen 2,245 52.5 +5.1 Liberal Democrats Honor Cox 1,860 43.5 -1.0 Labour A. Davis 173 4.0 -4.1 Majority 385 9.0 +6.1 Turnout 4,278 46.4 -3.2 Conservative hold Swing +3.0
Packwood[1] Party Candidate Votes % ±% Conservative Kenneth Meeson 2,858 62.5 +20.0 Liberal Democrats Jennifer Wright 1,589 34.8 -15.5 Labour Frederick Bradley 122 2.7 +0.2 Majority 1,269 27.8 +20.0 Turnout 4,569 48.3 -7.0 Conservative hold Swing +17.7
Shirley East[1] Party Candidate Votes % ±% Conservative Theresa Samuels 2,192 54.4 +11.9 Liberal Democrats Michael Southcombe 1,607 39.9 -8.5 Labour Derek Jones 233 5.8 -3.4 Majority 585 14.5 +8.6 Turnout 4,032 44.2 -4.3 Conservative hold Swing +10.2
Shirley South[1] Party Candidate Votes % ±% Independent Ursula Eames 2,787 53.1 +1.8 Conservative Philip Cross 2,152 41.0 +2.3 Labour Barry Beattie 305 5.8 -4.1 Majority 635 12.1 -0.4 Turnout 5,244 40.4 -6.4 Independent hold Swing -0.2
Shirley West[1] Party Candidate Votes % ±% Independent Ratepayers Jane Granger 1,919 55.0 +7.3 Conservative Denis Eyre 1,308 37.5 -0.2 Labour Robert Houghton 262 7.5 -7.1 Majority 611 17.5 +7.5 Turnout 3,489 37.2 -4.7 Independent Ratepayers hold Swing +3.7
Silhill[1] Party Candidate Votes % ±% Conservative Peter Hogarth 2,977 73.4 +12.9 Liberal Democrats Bernard Winchcombe 583 14.4 -8.2 Labour Donald Bargery 494 12.2 -4.7 Majority 2,394 59.0 +21.2 Turnout 4,054 40.0 -6.0 Conservative hold Swing +10.6
Smith's Wood [1] Party Candidate Votes % ±% Labour Graham Craig 1,171 60.8 -7.6 Conservative Richard Hubbard 698 36.2 +10.7 Green Peter May 58 3.0 -3.1 Majority 473 24.5 -18.3 Turnout 1,927 21.7 -9.1 Labour hold Swing -9.1
St. Alphege[1] Party Candidate Votes % ±% Conservative Stephen Eyre 3,476 79.3 +17.1 Green Clifford Hards 646 14.7 -10.5 Labour J. Yeomans 263 6.0 -6.6 Majority 2,830 64.5 +27.7 Turnout 4,385 44.0 -7.8 Conservative hold Swing +13.8
References ^ a b c d e f g h i j k l m n o p q r "Solihull M. B. C. Election Results Sheet, 7 May 1992", Solihull M.B.C.(1992). ^ "Vote 2012: Solihull". BBC News Online . Retrieved 26 January 2013 .
 Council elections in the West Midlands


