U.S. House district for Maryland
| Maryland's 8th congressional district |
|---|
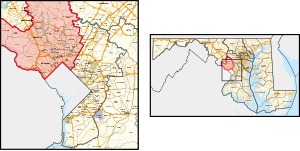
Interactive map of district boundaries since January 3, 2023 |
| Representative | | | Jamie Raskin
D–Takoma Park |
|
|---|
| Area | 297.06 sq mi (769.4 km2) |
|---|
| Distribution | |
|---|
| Population (2022) | 755,348 |
|---|
Median household
income | $123,494[1] |
|---|
| Ethnicity | - 44.3% White
- 19.7% Hispanic
- 16.3% Black
- 14.0% Asian
- 4.7% Two or more races
- 1.0% other
|
|---|
| Cook PVI | D+29[2] |
|---|
Maryland's 8th congressional district is concentrated almost entirely in Montgomery County, with a small portion in Prince George's County.[3] Adjacent to Washington, D.C., the 8th district takes in many of the city’s wealthiest inner-ring suburbs, including Bethesda, Chevy Chase, and Potomac. It also includes several more economically and racially diverse communities, the most populous of which are Rockville and Silver Spring.
With a median household income of $120,948, it is the ninth-wealthiest congressional district in the nation. The 8th district also has the eighth-highest share of residents with at least a bachelor's degree, at 63.9%. Those above-average numbers are largely due to the substantial presence of the federal government in nearby Washington, where thousands of the 8th district’s residents commute to work on a daily basis. Several federal agencies are likewise located within the 8th district, including the Food and Drug Administration, the National Institutes of Health, the Nuclear Regulatory Commission, and the Walter Reed National Military Medical Center. Two Fortune 500 companies are headquartered in the district: Lockheed Martin and Marriott International.[4] Almost 40% of the district's residents are immigrants, with the largest numbers coming from El Salvador, Ethiopia, India, China, Korea, Guatemala, and Peru. The district includes the Little Ethiopia area of Silver Spring and Takoma Park, and has the largest Ethiopian American population of any congressional district.[5]
Politically, the district is heavily liberal. It has consistently sent Democratic representatives to Congress by wide margins since 2002. In 2020, Joe Biden won nearly 80% of its vote. Democrat Jamie Raskin has represented the seat since 2017.
History
The district was created after the 1790 census in time for the 1792 election, was abolished after the 1830 census, and was reinstated after the 1960 census.
During redistricting after the 2000 census, the Democratic-dominated Maryland legislature sought to unseat then-incumbent Republican Connie Morella[citation needed]. One proposal went so far as to divide the district in two, effectively giving one to state Senator Christopher Van Hollen, Jr. and forcing Morella to run against popular Maryland State Delegate and Kennedy political family member Mark Kennedy Shriver[citation needed]. The final redistricting plan was less ambitious, restoring an eastern, heavily Democratic spur of Montgomery County removed in the 1990 redistricting to the 8th District[citation needed] (encompassing nearly all of the area "inside the Beltway"), as well as adding an adjacent portion from heavily Democratic Prince George's County. Although it forced Van Hollen and Shriver to run against each other in an expensive primary, the shift still made the district even more Democratic than its predecessor, and Van Hollen defeated Morella in 2002.
From 2003 to 2013 the district, in addition to the larger part of Montgomery County and the small portion of Prince George's County, included most of Frederick County (but not the City of Frederick), and southern Carroll County. The redrawn district was slightly less Democratic than its predecessor. While the Carroll and Frederick portions of the district tilted strongly Republican, the Montgomery County portion had twice as many people as the rest of the district combined, and Montgomery's Democratic tilt was enough to keep the district in the Democratic column. Since Morella left office, no Republican has crossed the 40 percent mark in the 8th District.
Communities
Since 2023, the following communities are located within the 8th district.[6]
Entirely within the district
Partially within the district
Recent statewide election results
Recent elections
1960s
Maryland's 8th congressional district election (new district), 1966[7] | Party | Candidate | Votes | % |
| | Republican | Gilbert Gude | 71,050 | 54.40 |
| | Democratic | Royce Hanson | 59,568 | 45.60 |
| Total votes | 130,618 | 100.00 |
Maryland's 8th congressional district election, 1968[8] | Party | Candidate | Votes | % |
| | Republican | Gilbert Gude (Incumbent) | 109,167 | 60.89 |
| | Democratic | Margaret C. Schweinhaut | 70,109 | 39.11 |
| Total votes | 179,276 | 100.00 |
| | Republican hold |
1970s
Maryland's 8th congressional district election, 1970[9] | Party | Candidate | Votes | % |
| | Republican | Gilbert Gude (Incumbent) | 104,647 | 63.38 |
| | Democratic | Thomas Hale Boggs, Jr. | 60,456 | 36.62 |
| Total votes | 165,103 | 100.00 |
| | Republican hold |
Maryland's 8th congressional district election, 1972[10] | Party | Candidate | Votes | % |
| | Republican | Gilbert Gude (Incumbent) | 137,287 | 63.90 |
| | Democratic | Joseph G. Anastasi | 77,551 | 36.10 |
| Total votes | 214,838 | 100.00 |
| | Republican hold |
Maryland's 8th congressional district election, 1974[11] | Party | Candidate | Votes | % |
| | Republican | Gilbert Gude (Incumbent) | 104,675 | 65.92 |
| | Democratic | Sidney Kramer | 54,112 | 34.08 |
| Total votes | 158,787 | 100.00 |
| | Republican hold |
Maryland's 8th congressional district election, 1976[12] | Party | Candidate | Votes | % |
| | Republican | Newton Steers | 111,274 | 46.82 |
| | Democratic | Lanny Davis | 100,343 | 42.22 |
| | Independent | Robin Ficker | 26,035 | 10.96 |
| Total votes | 237,652 | 100.00 |
| | Republican hold |
Maryland's 8th congressional district election, 1978[13] | Party | Candidate | Votes | % |
| | Democratic | Michael D. Barnes | 81,851 | 51.27 |
| | Republican | Newton Steers (Incumbent) | 77,807 | 48.73 |
| Total votes | 159,658 | 100.00 |
| | Democratic gain from Republican |
1980s
Maryland's 8th congressional district election, 1980[14] | Party | Candidate | Votes | % |
| | Democratic | Michael D. Barnes (Incumbent) | 148,301 | 59.33 |
| | Republican | Newton Steers | 101,659 | 40.67 |
| Total votes | 249,960 | 100.00 |
| | Democratic hold |
Maryland's 8th congressional district election, 1982[15] | Party | Candidate | Votes | % |
| | Democratic | Michael D. Barnes (Incumbent) | 121,761 | 71.34 |
| | Republican | Elizabeth W. Spencer | 48,910 | 28.66 |
| Total votes | 170,671 | 100.00 |
| | Democratic hold |
Maryland's 8th congressional district election, 1984[16] | Party | Candidate | Votes | % |
| | Democratic | Michael D. Barnes (Incumbent) | 181,947 | 71.47 |
| | Republican | Albert Ceccone | 70,715 | 27.78 |
| | Libertarian | Samuel K. Grove | 1,903 | 0.75 |
| | Write-ins | | 4 | <0.01 |
| Total votes | 254,569 | 100.00 |
| | Democratic hold |
Maryland's 8th congressional district election, 1986[17] | Party | Candidate | Votes | % |
| | Republican | Connie Morella | 92,917 | 52.87 |
| | Democratic | Stewart Bainum | 82,825 | 47.13 |
| Total votes | 175,742 | 100.00 |
| | Republican gain from Democratic |
Maryland's 8th congressional district election, 1988[18] | Party | Candidate | Votes | % |
| | Republican | Connie Morella (Incumbent) | 172,619 | 62.75 |
| | Democratic | Peter Franchot | 102,478 | 37.25 |
| Total votes | 275,097 | 100.00 |
| | Republican hold |
1990s
Maryland's 8th congressional district election, 1990[19] | Party | Candidate | Votes | % |
| | Republican | Connie Morella (Incumbent) | 130,059 | 73.53 |
| | Democratic | James Walker | 39,343 | 22.24 |
| | Independent | Sidney Altman | 7,485 | 4.23 |
| Total votes | 176,887 | 100.00 |
| | Republican hold |
Maryland's 8th congressional district election, 1992[20] | Party | Candidate | Votes | % |
| | Republican | Connie Morella (Incumbent) | 203,377 | 72.53 |
| | Democratic | Edward J. Heffernan | 77,042 | 27.47 |
| Total votes | 280,419 | 100.00 |
| | Republican hold |
Maryland's 8th congressional district election, 1994[21] | Party | Candidate | Votes | % |
| | Republican | Connie Morella (Incumbent) | 143,449 | 70.28 |
| | Democratic | Steven Van Grack | 60,660 | 29.72 |
| Total votes | 204,109 | 100.00 |
| | Republican hold |
Maryland's 8th congressional district election, 1996[22] | Party | Candidate | Votes | % |
| | Republican | Connie Morella (Incumbent) | 152,538 | 61.22 |
| | Democratic | Donald Mooers | 96,229 | 38.62 |
| Total votes | 249,146 | 100.00 |
| | Republican hold |
Maryland's 8th congressional district election, 1998[23] | Party | Candidate | Votes | % |
| | Republican | Connie Morella (Incumbent) | 133,145 | 60.34 |
| | Democratic | Ralph G. Neas | 87,497 | 39.66 |
| Total votes | 220,642 | 100.00 |
| | Republican hold |
2000s
Maryland's 8th congressional district election, 2000[24] | Party | Candidate | Votes | % |
| | Republican | Connie Morella (Incumbent) | 156,241 | 52.00 |
| | Democratic | Terry Lierman | 136,840 | 45.54 |
| | Constitution | Brian D. Saunders | 7,017 | 2.34 |
| | Write-ins | | 371 | 0.12 |
| Total votes | 300,469 | 100.00 |
| | Republican hold |
Maryland's 8th congressional district election, 2002[25] | Party | Candidate | Votes | % |
| | Democratic | Chris Van Hollen | 112,788 | 51.74 |
| | Republican | Connie Morella (Incumbent) | 103,587 | 47.52 |
| | Write-ins | | 1,599 | 0.73 |
| Total votes | 217,974 | 100.00 |
| | Democratic gain from Republican |
Maryland's 8th congressional district election, 2004[26] | Party | Candidate | Votes | % |
| | Democratic | Chris Van Hollen (Incumbent) | 215,129 | 74.91 |
| | Republican | Chuck Floyd | 71,989 | 25.07 |
| | Write-ins | | 79 | 0.03 |
| Total votes | 287,197 | 100.00 |
| | Democratic hold |
Maryland's 8th congressional district election, 2006[27] | Party | Candidate | Votes | % |
| | Democratic | Chris Van Hollen (Incumbent) | 168,872 | 76.52 |
| | Republican | Jeffrey M. Stein | 48,324 | 21.90 |
| | Green | Gerard P. Giblin | 3,298 | 1.49 |
| | Write-ins | | 191 | 0.09 |
| Total votes | 220,685 | 100.00 |
| | Democratic hold |
Maryland's 8th congressional district election, 2008[28] | Party | Candidate | Votes | % |
| | Democratic | Chris Van Hollen (Incumbent) | 229,740 | 75.08 |
| | Republican | Steve Hudson | 66,351 | 21.68 |
| | Green | Gordon Clark | 6,828 | 2.23 |
| | Libertarian | Ian Thomas | 2,562 | 0.84 |
| | Write-in | All write-ins | 533 | 0.17 |
| Total votes | 306,014 | 100.00 |
| | Democratic hold |
2010s
Maryland's 8th congressional district election, 2010[29] | Party | Candidate | Votes | % |
| | Democratic | Chris Van Hollen (Incumbent) | 153,613 | 73.27 |
| | Republican | Michael Lee Philips | 52,421 | 25.00 |
| | Libertarian | Mark Grannis | 2,713 | 1.29 |
| | Constitution | Fred Nordhorn | 696 | 0.33 |
| | No party | Write-ins | 224 | 0.11 |
| Total votes | 209,667 | 100.00 |
| | Democratic hold |
Maryland's 8th congressional district election, 2012[30] | Party | Candidate | Votes | % |
| | Democratic | Chris Van Hollen (Incumbent) | 217,531 | 63.37 |
| | Republican | Kenneth R. Timmerman | 113,033 | 32.93 |
| | Libertarian | Mark Grannis | 7,235 | 2.11 |
| | Green | George Gluck | 5,064 | 1.48 |
| | N/A | Others (write-in) | 393 | 0.11 |
| Total votes | 343,256 | 100 |
| | Democratic hold |
Maryland's 8th congressional district election, 2014[31] | Party | Candidate | Votes | % |
| | Democratic | Chris Van Hollen (Incumbent) | 136,722 | 60.74 |
| | Republican | Dave Wallace | 87,859 | 39.03 |
| | N/A | Others (write-in) | 516 | 0.23 |
| Total votes | 225,097 | 100.00 |
| | Democratic hold |
Maryland's 8th congressional district election, 2016[32] | Party | Candidate | Votes | % |
| | Democratic | Jamie Raskin | 220,657 | 60.6 |
| | Republican | Dan Cox | 124,651 | 34.2 |
| | Green | Nancy Wallace | 11,201 | 3.1 |
| | Libertarian | Jasen Wunder | 7,283 | 2.0 |
| | N/A | Others (write-in) | 532 | 0.1 |
| Total votes | 364,324 | 100.00 |
| | Democratic hold |
Maryland's 8th congressional district, 2018 | Party | Candidate | Votes | % |
| | Democratic | Jamie Raskin (Incumbent) | 217,679 | 68.2 |
| | Republican | John Walsh | 96,525 | 30.2 |
| | Libertarian | Jasen Wunder | 4,853 | 1.5 |
| | n/a | Write-ins | 273 | 0.1 |
| Total votes | 319,330 | 100.0 |
| | Democratic hold |
2020s
Maryland's 8th congressional district, 2020[33] | Party | Candidate | Votes | % |
| | Democratic | Jamie Raskin (incumbent) | 274,716 | 68.2 |
| | Republican | Gregory Thomas Coll | 127,157 | 31.6 |
| | Write-in | 741 | 0.2 |
| Total votes | 402,614 | 100.0 |
| | Democratic hold |
Maryland's 8th congressional district, 2022 | Party | Candidate | Votes | % |
| | Democratic | Jamie Raskin (incumbent) | 211,842 | 80.2 |
| | Republican | Gregory Coll | 47,965 | 18.1 |
| | Libertarian | Andrés Garcia | 4,125 | 1.6 |
| | Write-in | 274 | 0.1 |
| Total votes | 264,206 | 100.0 |
| | Democratic hold |
List of members representing the district
| # | Member | Party | Years | Con-
gress | Electoral history | District location |
| District created March 4, 1793 |
| 1 | 
William Vans Murray
(Cambridge) | Pro-Administration | March 4, 1793 –
March 3, 1795 | 3rd
4th | Redistricted from the 5th district and re-elected in 1792.
Re-elected in 1794.
Retired. | 1793–1803
[data missing] |
| Federalist | March 4, 1795 –
March 3, 1797 |
| 2 | 
John Dennis
(Somerset County) | Federalist | March 4, 1797 –
March 3, 1805 | 5th
6th
7th
8th | Elected in 1796.
Re-elected in 1798.
Re-elected in 1801.
Re-elected in 1803.
Retired. |
1803–1813
[data missing] |
| 3 | 
Charles Goldsborough
(Cambridge) | Federalist | March 4, 1805 –
March 3, 1817 | 9th
10th
11th
12th
13th
14th | Elected in 1804.
Re-elected in 1806.
Re-elected in 1808.
Re-elected in 1810.
Re-elected in 1812.
Re-elected in 1814.
Retired. |
1813–1823
[data missing] |
| 4 | Thomas Bayly
(Princess Anne) | Federalist | March 4, 1817 –
March 3, 1823 | 15th
16th
17th | Elected in 1816.
Re-elected in 1818.
Re-elected in 1820.
Retired. |
| 5 | John S. Spence
(Poplartown) | Democratic-Republican[a] | March 4, 1823 –
March 3, 1825 | 18th | Elected in 1822.
Lost re-election. | 1823–1833
[data missing] |
| 6 | Robert N. Martin
(Princess Anne) | Anti-Jacksonian | March 4, 1825 –
March 3, 1827 | 19th | Elected in 1824.
Retired. |
| 7 | Ephraim King Wilson
(Snow Hill) | Anti-Jacksonian | March 4, 1827 –
March 3, 1829 | 20th
21st | Re-elected in 1826.
Re-elected in 1829.
Retired. |
| Jackson | March 4, 1829 –
March 3, 1831 |
| 8 | John S. Spence
(Berlin) | Anti-Jacksonian | March 4, 1831 –
March 3, 1833 | 22nd | Elected in 1831.
[data missing] |
| 9 | John T. Stoddert
(Harris Lot) | Jackson | March 4, 1833 –
March 3, 1835 | 23rd | Elected in 1833.
Retired. | 1833–1835
[data missing] |
| Seat eliminated March 4, 1835 |
| Seat re-created January 3, 1967 |
| 10 | 
Gilbert Gude
(Bethesda) | Republican | January 3, 1967 –
January 3, 1977 | 90th
91st
92nd
93rd
94th | Elected in 1966.
Re-elected in 1968.
Re-elected in 1970.
Re-elected in 1972.
Re-elected in 1974.
Retired. | 1967–1973
Montgomery |
1973–1983
Montgomery |
| 11 | 
Newton Steers
(Bethesda) | Republican | January 3, 1977 –
January 3, 1979 | 95th | Elected in 1976.
Lost re-election. |
| 12 | 
Michael D. Barnes
(Kensington) | Democratic | January 3, 1979 –
January 3, 1987 | 96th
97th
98th
99th | Elected in 1978.
Re-elected in 1980.
Re-elected in 1982.
Re-elected in 1984.
Retired to run for U.S. Senator. |
1983–1993
Montgomery |
| 13 | 
Connie Morella
(Bethesda) | Republican | January 3, 1987 –
January 3, 2003 | 100th
101st
102nd
103rd
104th
105th
106th
107th | Elected in 1986.
Re-elected in 1988.
Re-elected in 1990.
Re-elected in 1992.
Re-elected in 1994.
Re-elected in 1996.
Re-elected in 1998.
Re-elected in 2000.
Lost re-election after redistricting. |
1993–2003
Montgomery |
| 14 | 
Chris Van Hollen
(Kensington) | Democratic | January 3, 2003 –
January 3, 2017 | 108th
109th
110th
111th
112th
113th
114th | Elected in 2002.
Re-elected in 2004.
Re-elected in 2006.
Re-elected in 2008.
Re-elected in 2010.
Re-elected in 2012.
Re-elected in 2014.
Retired to run for U.S. Senator. | 2003–2013

Montgomery, Prince George's |
2013–2023

Montgomery, Frederick, Carroll |
| 15 | 
Jamie Raskin
(Takoma Park) | Democratic | January 3, 2017 –
present | 115th
116th
117th
118th | Elected in 2016.
Re-elected in 2018.
Re-elected in 2020.
Re-elected in 2022. |
2023–present
Montgomery |
See also
 United States portal
 Maryland portal
Notes
External links
- FairVote.org: Maryland's Redistricting News March 16, 2001 – October 18, 2001
- District boundaries, 1992–2002
Sources
- ^ "My Congressional District".
- ^ "2022 Cook PVI: District Map and List". The Cook Political Report. July 12, 2022. Retrieved October 8, 2022.
- ^ "Congressional District Maps". Prince George's County. Retrieved May 2, 2024.
- ^ "Visualize the Fortune 500". Fortune. Retrieved May 17, 2023.
- ^ "The Demographic Statistical Atlas of the United States - Statistical Atlas". statisticalatlas.com. Retrieved January 14, 2024.
- ^ "MD 2022 Congressional". Dave's Redistricting. Retrieved November 4, 2023.
- ^ Clerk of the House of Representatives (March 31, 1967). "Statistics of the Contressional Election of November 8, 1966" (PDF). U.S. Government Printing Office. Retrieved June 5, 2017.
- ^ Clerk of the House of Representatives (July 1, 1969). "Statistics of the Presidential and Congressional Election of November 5, 1968" (PDF). U.S. Government Printing Office. Retrieved June 5, 2017.
- ^ Clerk of the House of Representatives (May 1, 1971). "Statistics of the Congressional Election of November 3, 1970" (PDF). U.S. Government Printing Office. Retrieved June 5, 2017.
- ^ Clerk of the House of Representatives (March 15, 1973). "Statistics of the Presidential and Congressional Election of November 7, 1972" (PDF). U.S. Government Printing Office. Retrieved June 5, 2017.
- ^ Clerk of the House of Representatives (August 1, 1975). "Statistics of the Congressional Election of November 4, 1974" (PDF). U.S. Government Printing Office. Retrieved June 5, 2017.
- ^ Clerk of the House of Representatives (April 15, 1977). "Statistics of the Presidential and Congressional Election of November 2, 1976" (PDF). U.S. Government Printing Office. Retrieved June 5, 2017.
- ^ Clerk of the House of Representatives (April 1, 1979). "Statistics of the Congressional Election of November 7, 1978" (PDF). U.S. Government Printing Office. Retrieved June 5, 2017.
- ^ Clerk of the House of Representatives (April 15, 1981). "Statistics of the Presidential and Congressional Election of November 4, 1980" (PDF). U.S. Government Printing Office. Retrieved June 5, 2017.
- ^ Clerk of the House of Representatives (May 5, 1983). "Statistics of the Congressional Election of November 2, 1982" (PDF). U.S. Government Printing Office. Retrieved June 5, 2017.
- ^ Clerk of the House of Representatives (May 1, 1985). "Statistics of the Presidential and Congressional Election of November 6, 1984" (PDF). U.S. Government Printing Office. Retrieved June 5, 2017.
- ^ Clerk of the House of Representatives (May 29, 1987). "Statistics of the Congressional Election of November 3, 1986" (PDF). U.S. Government Printing Office. Retrieved June 5, 2017.
- ^ Clerk of the House of Representatives (April 20, 1989). "Statistics of the Presidential and Congressional Election of November 8, 1988" (PDF). U.S. Government Printing Office. Retrieved June 5, 2017.
- ^ Clerk of the House of Representatives (April 29, 1991). "Statistics of the Congressional Election of November 6, 1990" (PDF). U.S. Government Printing Office. Retrieved June 5, 2017.
- ^ Clerk of the House of Representatives (May 31, 1993). "Statistics of the Presidential and Congressional Election of November 3, 1992" (PDF). U.S. Government Printing Office. Retrieved June 5, 2017.
- ^ Clerk of the House of Representatives (May 12, 1995). "Statistics of the Congressional Election of November 8, 1994" (PDF). U.S. Government Printing Office. Retrieved June 5, 2017.
- ^ Clerk of the House of Representatives (July 29, 1997). "Statistics of the Presidential and Congressional Election of November 5, 1996" (PDF). U.S. Government Printing Office. Retrieved June 5, 2017.
- ^ Clerk of the House of Representatives (January 3, 1999). "Statistics of the Congressional Election of November 3, 1998" (PDF). U.S. Government Printing Office. Retrieved June 5, 2017.
- ^ Clerk of the House of Representatives (June 21, 2001). "Statistics of the Presidential and Congressional Election of November 7, 2000" (PDF). U.S. Government Printing Office. Retrieved June 5, 2017.
- ^ Clerk of the House of Representatives (May 1, 2003). "Statistics of the Congressional Election of November 5, 2002" (PDF). U.S. Government Printing Office. Retrieved June 5, 2017.
- ^ Clerk of the House of Representatives (June 7, 2005). "Statistics of the Presidential and Congressional Election of November 2, 2004" (PDF). U.S. Government Printing Office. Retrieved June 5, 2017.
- ^ Clerk of the House of Representatives (September 21, 2007). "Statistics of the Congressional Election of November 7, 2006" (PDF). U.S. Government Printing Office. Retrieved June 5, 2017.
- ^ Clerk of the House of Representatives (July 10, 2009). "Statistics of the Presidential and Congressional Election of November 4, 2008" (PDF). U.S. Government Printing Office. Retrieved June 5, 2017.
- ^ Clerk of the House of Representatives (June 3, 2011). "Statistics of the Congressional Election of November 2, 2010" (PDF). U.S. Government Printing Office. Retrieved June 5, 2017.
- ^ Clerk of the House of Representatives (February 28, 2013). "Statistics of the Presidential and Congressional Election of November 6, 2012" (PDF). U.S. Government Printing Office. Retrieved June 5, 2017.
- ^ "Official 2014 Gubernatorial General Election results for Representative in Congress". Maryland State Board of Elections. December 2, 2014. Retrieved June 5, 2017.
- ^ "Official 2016 Presidential General Election results for Representative in Congress". Maryland State Board of Elections. December 9, 2016. Retrieved June 5, 2017.
- ^ "Official 2020 Presidential General Election results for Representative in Congress". Maryland State Board of Elections. Retrieved December 14, 2020.
- Archives of Maryland Historical List United States Representatives Maryland State Archives
- Martis, Kenneth C. (1989). The Historical Atlas of Political Parties in the United States Congress. New York: Macmillan Publishing Company.
- Martis, Kenneth C. (1982). The Historical Atlas of United States Congressional Districts. New York: Macmillan Publishing Company.
- Congressional Biographical Directory of the United States 1774–present
39°06′N 77°15′W / 39.1°N 77.25°W / 39.1; -77.25


