2003 UK local government election
The 2003 Plymouth City Council election was held on 1 May 2003 to elect members of Plymouth City Council in England. This was on the same day as the other local elections . The election was the first to be contested under new ward boundaries, and as a result the entire council was up for election. The Labour Party regained control of the council, which it had lost to the Conservative Party at the previous election in 2000 .[1] [2] [3]
Overall results 2003 Plymouth City Council Election Party Seats Gains Losses Net gain/loss Seats % Votes % Votes +/− Labour 36 14 63.2 43.2 24,849 7.3 Conservative 18 9 31.6 32.0 18,421 16.1 Liberal Democrats 3 2 5.3 18.3 10,515 3.7 Plymouth Party 0 0.0 1.8 1,046 New Green 0 0.0 1.7 976 1.2 UKIP 0 0.0 1.3 753 New Independent 0 0.0 1.1 659 0.9 BNP 0 0.0 0.3 192 New Socialist Alliance (England) 0 0.0 0.2 143 New Total 57 57,303
Ward results Budshead Location of Budshead ward Budshead 2003 Party Candidate Votes % Labour R Simmonds 1,487 Labour T Coleman 1,439 Labour C Mavin 1,408 Conservative P Brookshaw 1,092 Conservative J Harden 1,027 Conservative G Horler 1,011 Liberal Democrats C Summerfield 396 Liberal Democrats J Fitzroy 394 Liberal Democrats R Dogan 374 Turnout 31.0% Labour win (new seat) Labour win (new seat) Labour win (new seat)
Compton Location of Compton ward Compton 2003 Party Candidate Votes % Conservative D Stark 1,458 Conservative A Fry 1,436 Conservative T Savery 1,413 Labour S Barker 858 Labour S Oxenham 825 Labour C Rennie 821 Liberal Democrats R Fells 720 Liberal Democrats M Walker 712 Liberal Democrats R Casley 710 Turnout 32.9% Conservative win (new seat) Conservative win (new seat) Conservative win (new seat)
Devonport Location of Devonport ward Devonport 2003 Party Candidate Votes % Labour B Brotherton 1,421 Labour W Stevens 1,313 Labour N Wildy 1,301 Conservative J Bell 574 Conservative E Gray 537 Conservative J Johnson 509 Liberal Democrats C Prigmore 290 Liberal Democrats T Colley 251 Liberal Democrats C MacCullie 248 Independent J Brooks 245 BNP G Green 192 Plymouth Party W Luck 178 Turnout 26.1% Labour win (new seat) Labour win (new seat) Labour win (new seat)
Drake Location of Drake ward Drake 2003 Party Candidate Votes % Liberal Democrats K Gillard 580 Liberal Democrats D Santillo 537 Labour R Bellamy 380 Labour D Howells 361 Conservative P Marshall 281 Conservative C Miles 272 Socialist Alliance P Heddle 69 Turnout 18.6% Liberal Democrats win (new seat) Liberal Democrats win (new seat)
Efford and Lipson Location of Efford and Lipson ward Efford and Lipson 2003 Party Candidate Votes % Labour B Miller 1,784 Labour A Kerswell 1,766 Labour B Vincent 1,752 Liberal Democrats N Sewell 634 Liberal Democrats D Wood 619 Conservative M Orchard 613 Liberal Democrats L Burrows 607 Conservative R Lloyd 583 Conservative R McVicar 554 Turnout 31.7% Labour win (new seat) Labour win (new seat) Labour win (new seat)
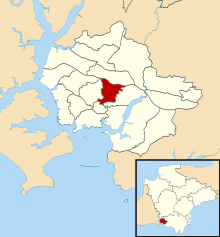
Eggbuckland Location of Eggbuckland ward Eggbuckland 2003 Party Candidate Votes % Labour D Bray 1,387 Labour L Finn 1,323 Labour S Lemin 1,278 Conservative C Nunn 1,182 Conservative M Foster 1,164 Conservative P Rowe 1,158 Liberal Democrats M Bellamy 584 Liberal Democrats R Bellamy 560 Liberal Democrats T Smith 511 Turnout 32.5% Labour win (new seat) Labour win (new seat) Labour win (new seat)
Ham Location of Ham ward Ham 2003 Party Candidate Votes % Labour Tudor Evans 1,912 Labour I Gordon 1,784 Labour C Pattison 1,746 Conservative S Ashcroft 553 Conservative D Bothwick 507 Conservative T Thomas 503 Liberal Democrats M Black 407 Liberal Democrats K Black 394 Liberal Democrats L Pearson 330 Plymouth Party S Charles 166 Turnout 29.9% Labour win (new seat) Labour win (new seat) Labour win (new seat)
Honicknowle Location of Honicknowle ward Honicknowle 2003 Party Candidate Votes % Labour P Carter 1,689 Labour P Purnell 1,611 Labour P Smith 1,574 Conservative B Baker 520 Conservative R Mahony 502 Conservative J Coope 489 Liberal Democrats J Crocker 422 Liberal Democrats M O'Neil 374 Liberal Democrats M Swann 362 Turnout 25.6% Labour win (new seat) Labour win (new seat) Labour win (new seat)
Moor View Location of Moor View ward Moor View 2003 Party Candidate Votes % Labour S Dann 1,527 Labour M Fox 1,489 Labour P Hutchings 1,474 Conservative H Ellis 899 Conservative J Ellis 863 Conservative A Sloggett 829 Liberal Democrats A Campbell 491 Liberal Democrats D Spreat 408 Liberal Democrats J Spreat 401 Turnout 30.4% Labour win (new seat) Labour win (new seat) Labour win (new seat)
Peverell Location of Peverell ward Peverell 2003 Party Candidate Votes % Conservative J Mahony 1,435 Conservative M Leaves 1,373 Conservative P Nicholson 1,354 Labour C Woodman 1,049 Labour C Rose 1,002 Labour R Sharman 980 Liberal Democrats V Costain 847 Liberal Democrats E Swann 792 Liberal Democrats M Shally 763 Green F Allen 322 UKIP R Sigrist 301 UKIP C Bragg 284 UKIP P Martin-Kaye 260 Independent A Sherry 85 Turnout 37.8% Labour win (new seat) Labour win (new seat) Labour win (new seat)
Plympton Chaddlewood Location of Plympton Chaddlewood ward Plympton Chaddlewood 2003 Party Candidate Votes % Conservative G Jordan 601 Conservative D Salter 572 Liberal Democrats J Byatt 377 Labour P Murphy 352 Liberal Democrats P Hutty 312 Labour J Wood 308 Independent D Every 211 Turnout 23.6% Conservative win (new seat) Conservative win (new seat)
Plympton Erle Location of Plympton Erle ward Plympton Erle 2003 Party Candidate Votes % Conservative J Fox 783 Liberal Democrats E Lock 764 Labour R Burns 713 Conservative D Birkenhead 697 Liberal Democrats S Jennett 668 Labour M Robinson 586 Turnout 31.8% Conservative win (new seat) Liberal Democrats win (new seat)
Plympton St Mary Location of Plympton St Mary ward Plympton St Mary 2003 Party Candidate Votes % Conservative P Nicholson 1,848 Conservative D James 1,741 Conservative D Ford 1,661 Labour J Henley 998 Labour V Burns 955 Labour S Robinson 860 Liberal Democrats P Fewings 638 Liberal Democrats A Cains 583 Liberal Democrats M Trench 478 Turnout 34.9% Conservative win (new seat) Conservative win (new seat) Conservative win (new seat)
Plymstock Dunstone Location of Plymstock Dunstone ward Plymstock Dunstone 2003 Party Candidate Votes % Conservative D Viney 1,866 Conservative V Pengelly 1,769 Conservative K Wigens 1,681 Labour R Evans 975 Labour C Childs 842 Labour D Roche 808 Liberal Democrats P Jones 482 Liberal Democrats R Tofts 481 Liberal Democrats J Evans 478 Turnout 29.8% Conservative win (new seat) Conservative win (new seat) Conservative win (new seat)
Plymstock Radford Location of Plymstock Radford ward Plymstock Radford 2003 Party Candidate Votes % Conservative K Foster 1,208 Conservative W Foster 1,156 Conservative M Leaves 1,128 Labour R Dodd 1,123 Labour J Clynch 1,062 Labour W Wraight 844 Liberal Democrats C Burrows 500 UKIP R Bullock 452 UKIP A Skuse 414 UKIP D McCallum 408 Liberal Democrats M Chandler 405 Liberal Democrats S Kendrick 372 Turnout 34.2% Conservative win (new seat) Conservative win (new seat) Conservative win (new seat)
St Budeax Location of St Budeaux ward St Budeaux 2003 Party Candidate Votes % Labour G Wheeler 1,560 Labour C Blackburn 1,475 Labour D Williams 1,426 Conservative H Plymsol 520 Conservative P Crolla 513 Liberal Democrats R McSweeney 449 Conservative M White 421 Liberal Democrats G Hirst 379 Liberal Democrats M Gallagher 371 Turnout 24.9% Labour win (new seat) Labour win (new seat) Labour win (new seat)
St Peter and the Waterfront Location of St Peter and the Waterfront ward St Peter and the Waterfront 2003 (2 Councillors) Party Candidate Votes % Labour M King 1,040 Labour T Wildy 963 Labour V Hiromeris 958 Conservative F Brimacombe 728 Conservative A Angel 670 Conservative E Shillabeer 588 Liberal Democrats H Stone 535 Liberal Democrats J Newton 475 Liberal Democrats T Wickett 434 Plymouth Party K Kelway 365 Plymouth Party J Broughton 264 Plymouth Party S Billows 242 Green F Williamson 172 Independent S Ellis 118 Turnout 27.8% Labour win (new seat) Labour win (new seat) Labour win (new seat)
Southway Location of Southway ward Southway 2003 Party Candidate Votes % Labour D Camp 1,996 Labour J Kirk 1,728 Labour D Weekes 1,620 Conservative E Willey 836 Conservative E Dawson 732 Conservative J Plymsol 731 Liberal Democrats T O'Connor 372 Liberal Democrats C Curry 333 Liberal Democrats B Yardley 292 Turnout 27.8% Labour win (new seat) Labour win (new seat) Labour win (new seat)
Stoke Location of Stoke ward Stoke 2003 Party Candidate Votes % Labour M Fletcher 1,128 Labour G Shears 1,045 Labour D Haydon 1,007 Conservative C Pascoe 935 Conservative Y Dawson 926 Conservative G Monaghan 877 Liberal Democrats H Guy 506 Liberal Democrats S Guy 469 Liberal Democrats N Wickett 422 Green J Cavanagh 287 Plymouth Party I Fleming 178 Plymouth Party K Woodward 170 Turnout 29.0% Labour win (new seat) Labour win (new seat) Labour win (new seat)
Sutton and Mount Gould Location of Sutton and Mount Gould ward Sutton and Mount Gould 2003[4] Party Candidate Votes % Labour J Nelder 1,470 Labour M Aspinall 1,452 Labour E Rennie 1,337 Liberal Democrats C Brown 521 Liberal Democrats P York 492 Conservative J Parry 489 Conservative R Welchman 486 Conservative J White 472 Liberal Democrats G Nye 429 Green T Mitchell 195 Plymouth Party D Kelway 159 Plymouth Party R Brierley 127 Socialist Alliance R Manning 74 Socialist Alliance E Peonides 69 Socialist Alliance P Tozer 48 Turnout 28.0% Labour win (new seat) Labour win (new seat) Labour win (new seat)
References ^ "Local elections 2003" (PDF) . parliament.uk . Archived from the original (PDF) on 10 May 2020. Retrieved 18 March 2019 . ^ "Local Election Results 2003". Andrew Teale . ^ "Plymouth City Council Election Results 1997-2012" (PDF) . Elections Centre . ^ "| PLYMOUTH.GOV.UK". www.plymouth.gov.uk .


 14
14  9
9 


 Council elections in Devon


